

How Does Your
Industrial Manufacturing Website Stack Up?
Industrial Manufacturing Website Stack Up?
What we learned from analyzing
two thousand industrial-focused websites
As an industrial-focused marketing agency, we frequently get asked benchmark questions like:
- “What’s a good bounce rate for an industrial website?”
- “How many pages per visit is considered average for a site that focuses on technical manufacturing offerings?”
- “How does my ‘Average Visit Duration’ stack up to other manufacturing websites?”
- “How many backlinks do I need in order to rank highly on my targeted keywords?”
- “What’s a good ‘Authority Score’ for a business like mine?”
Just to name a few…
 Industrial Marketing
Website Report –
How Can We Help?
Ultimately, industrial marketers want to know: What exactly are the successful industrial companies doing from a website and online presence perspective? And how can I leverage these insights for my business?
Although we have answers to these questions based on the websites we manage for our industrial clients, we wanted to analyze a larger pool of industrial-focused websites to capture more data points and provide a more thorough response.
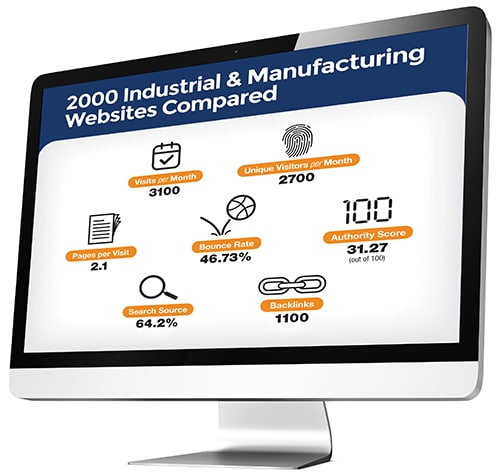
Recently our agency RH Blake engaged with SEMRush, a leading competitive intelligence platform for online marketing, to perform an indepth study on industrial-focused websites. The websites we reviewed belong to North American companies that are either manufacturers or sell to manufacturers, and range in revenues of $20M to $500M U.S. dollars. We reviewed the following variables shown in the image below.

- This metric is the estimated monthly number of visitors coming to the website from Google search results.
- Our research showed that the median number of visitors per month for industrial-focused firms is 3100. The number of visits per month is a fundamental metric that can help you better understand whether your online-focused marketing activities are helping drive traffic. Although, as mentioned above, this metric by itself doesn’t provide the whole story as it doesn’t take into account many critical variables such as the quality of this traffic, whether this traffic performed a meaningful action on the site, and the ROI of the investments made to generate this level of traffic.

-
- An estimation of total unique monthly visits to the website.
- The median number of unique visitors per month is 2700
- Getting a better appreciation of the number of unique visitors can be helpful in better understanding the user journey and how to best capitalize on each visit. Dividing the number of visits by the number of unique visitors yields the number of visits per unique visitor, which can be used to analyze engagement rates on a website and better recognize how many times each visitor visited that website. In our analysis, we found this number to be 1.14.

-
-
- An estimation of how many pages (on average) that a person will visit in one session on the website
- The median number of pages per visit is 2.1. Generally, the larger the number of pages per visit indicates that the content on a given website is meaningful and aligns with the user’s search focus. A low number may indicate the opposite; either the content is lacking or visitors on the site aren’t aligned with the content. While Pages per Visit is an important metric for helping measure the overall health of a website, monitoring this value in a vacuum may lead you in the wrong direction. Best practice: consider your ultimate objective with the site and see how that trends with pages per visit.
-

- This study shows that industrial manufacturing websites achieve 64.2% of their traffic via search – meaning a user came to a site directly from a search engine such as Google, Yahoo or Bing. The balance of the traffic is coming from Direct, Referral or Paid sources.
- How does your website compare to the 64.2% figure? Assuming that the overall traffic number stays the same, increasing the percentage of visits from search could have significant business benefits as search traffic tends to offer a higher ROI than other sources. Why? One key reason is that your website will have a better opportunity to position and align your offerings to the visitor’s search intent, providing a superior user experience which in turn should improve conversions and ROI.


- The average bounce rate for the websites analyzed was 46.73%. A website’s bounce rate is one of the most critical yet often misunderstood metrics in Google Analytics. The technical definition is an estimation of the website’s average bounce rate, or percentage of visitors who leave the website after viewing just one page. In more straightforward terms, think of a ‘bounce’ as a visitor landing on your website, not clicking or advancing to any other pages and then leaving.
- There are several variables to consider when determining how your bounce rate stacks up.
- Visitor Intent: What kind of information are your visitors looking for? Is it just your contact information or whether you have a specific part in inventory? In these instances, your visitors may find what they are looking for and leave the site – while increasing your bounce rate. Or are most of your visitors in deep information gathering mode and willing to invest and explore further to get the exact information they are looking for. As you can see, looking at bounce rate isn’t meaningful without also considering the context. But once you’ve identified a baseline, this is a valuable metric to focus on.
- Traffic Source: Where are your visitors coming from? Paid sources such as Display and Google AdWords tend to have a higher bounce rate than organic searches.
- Website Content: Does your content do an effective job of addressing the user’s search query? How are the pages that visitors are landing on designed? Are there clear and valuable links and/or calls to action to help further engage visitors? These are all questions to consider when developing a plan to improve your bounce rate.

-
-
- The total number of referring domains to a particular website.
- Our research shows that the median number of backlinks is 1103. Total Referring Domains including Backlinks was the fifth most important factor for driving organic traffic. This is because the number of backlinks coupled with the quality of the backlinks can help provide context into how authoritative a website is. In Google’s eyes (algorithm) a backlink is a vote of confidence one website provides to another. Thus, if a high-quality website includes a link to another website, Google interprets that this other website, by association, must also be of high quality.
-

- This is SEMRush’s compound metric that compiles the overall quality of a domain and measures it from 1 to 100. Authority Score is the most well-rounded score to use when evaluating domains as it indicates the strength, authority and popularity of the domain. Our research showed that the median Authority Score for industrial websites is 31.27.
- The score is based on the following SEMrush data:
- Backlink data including Domain Score, Trust Score, Referring Domains, Follow and No Follow Links, and more
- Organic search data including organic search traffic and positions
- Website traffic data
- Authority Score is an excellent data point to focus on as you’re implementing website improvements. It’s a quick snapshot of whether you’re headed in the right direction, and how your approach compares to competitors.
Get Your Free SEO Footprint™ Assessment
View your on-page SEO score as seen by Google compared to your direct competitors.
Receive a prioritized checklist with action items to help you get SEO wins.
Identify gaps in lead-generating content.
Better understand why visitors aren’t converting.